Weekly Meter
DC / MD / VA / WV
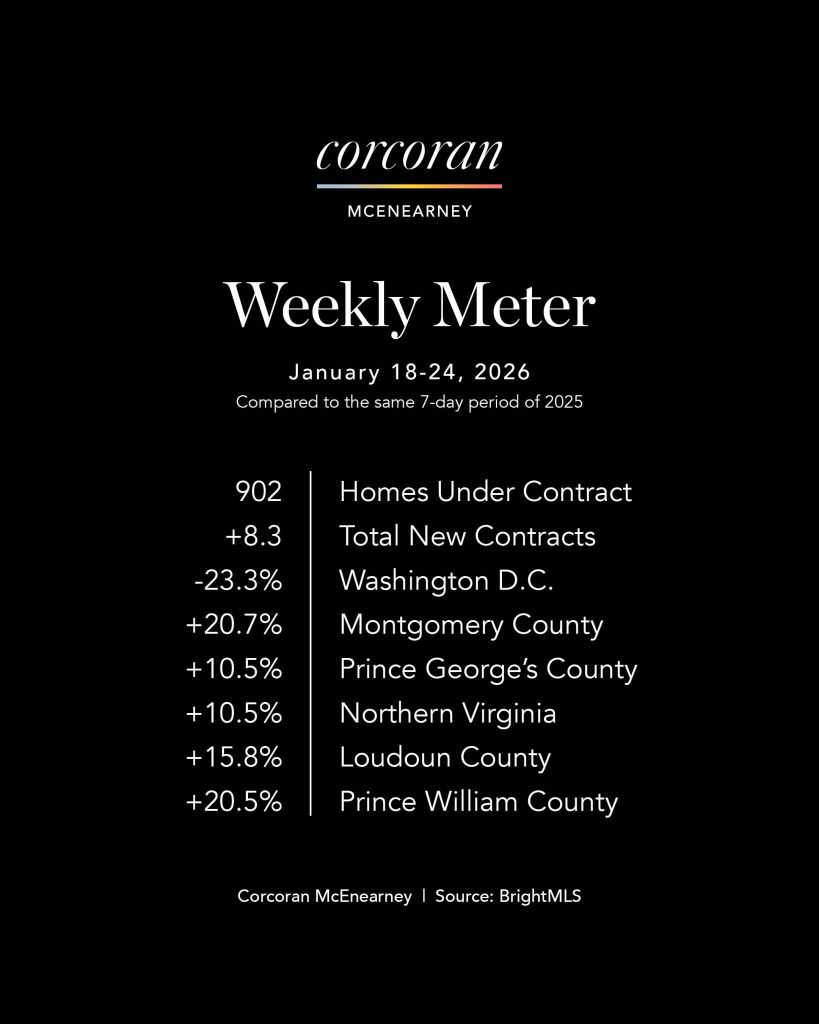
We compare contract activity for the same seven-day period of the previous year in Loudoun County, Prince William County, Northern Virginia, Washington, DC, and Prince George's County. These statistics are updated on a weekly basis. Sign up for our newsletter on the latest market data.

The Buyers Are Back — At Least For Now
Contract activity across the Metro DC area rose 8.3% compared to the same week last year.
Key Takeaways
- The looming snow/sleet/freezing rain storm may have brought buyers out a little earlier, contributing to a very good week for new contracts!
- Northern Virginia posted a solid weekly gain, driven almost entirely by strength above $750,000. Contracts over $1 million were up sharply, signaling renewed confidence among higher-end buyers. Entry-level and mid-range activity was comparatively flat, but year-to-date totals remain comfortably ahead of last year. Average days on market increased meaningfully, underscoring that buyers are active, but taking their time.
- Loudoun County continued to skew upscale. While total weekly contracts rose, growth was concentrated in the $750,000+ segments—particularly homes priced above $1.5 million. Entry-level activity softened further. Year-to-date performance remains strong overall, though the sharp jump in days on market suggests buyers are increasingly selective.
- Prince William County delivered one of the strongest weekly performances in the region. Contract activity surged under $750,000, especially in the $500,000–$749,999 range, while higher-priced segments pulled back. Year-to-date totals are running well ahead of last year, supported by sustained affordability-driven demand.
- Montgomery County saw a notable weekly increase, with gains across most price ranges and particularly strong activity between $500,000 and $1.5 million. Year-to-date contracts are up solidly, but days on market nearly doubled, reinforcing the region-wide theme of patient buyers.
- Prince George’s County posted a modest weekly gain overall, with strength in the $300,000–$499,999 range offset by softness elsewhere. Year-to-date totals are essentially flat compared to last year, and rising days on market continue to reflect affordability sensitivity.
- Washington, DC experienced a pullback this week. Contract activity declined sharply, particularly above $750,000, and year-to-date totals remain well below last year. Elevated days on market suggest ongoing hesitation among urban buyers, especially at higher price points.
Why It Matters
- Rising days on market across every jurisdiction confirm that this is a thinking market, not a rushing one. Days on market increased to 52 from 39 this time last year.
- Last year’s pattern of strength in the Northern Virginia suburbs and Montgomery County, Maryland, and relative weakness in Prince George’s County and Washington, DC continues.
- This remains a market defined by participation without urgency. Activity is broad, but buyers are clearly exercising choice and leverage—especially as inventory continues to build. Momentum is uneven by geography and price point, but the underlying demand signal remains intact heading toward the heart of the spring market.
Momentum Builds — and Broadens
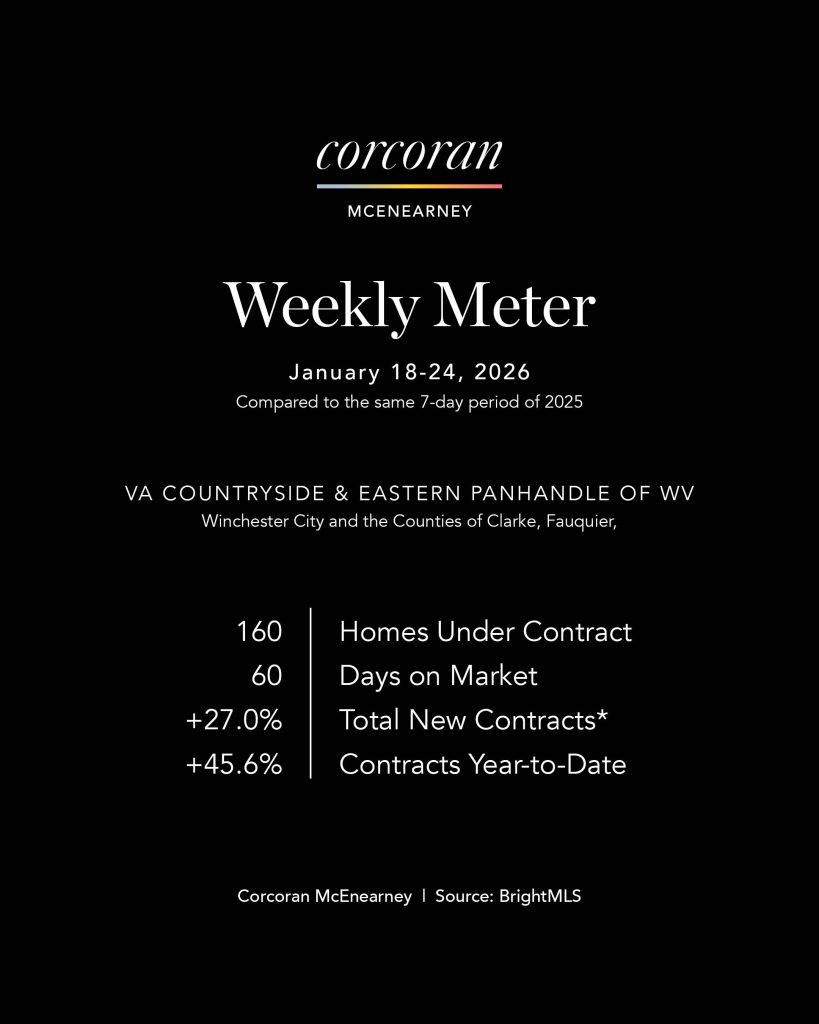
Contract activity for January 18 -24, 2026 in the Virginia Countryside and West Virginia Panhandle was up 27.0% compared to the same seven-day period last year.
Key Takeaways
- Weekly gains in the Virginia Countryside were broad-based, with notable strength under $750,000—particularly in the $300,000–$499,999 range, which saw a sharp increase in newly ratified contracts. Activity above $750,000 also accelerated meaningfully, including a notable rise in the $750,000–$999,999 segment.
- Year-to-date performance remains very strong, with total contracts up 33% compared to last year. Growth has been consistent across nearly all price categories, suggesting healthy depth to buyer demand rather than reliance on a single segment.
- Weekly gains in the WV Panhandle were also concentrated under $750,000. Activity above $750,000 remained limited, though year-to-date totals in higher price ranges are notably ahead of last year, reflecting gradual expansion of buyer interest.
Panhandle year-to-date contracts are up 12.6% overall, driven by steady performance in the mid-price segments that define this market.
Why It Matters
- Average days on market declined week over week in the Countryside, a notable contrast to many suburban and urban jurisdictions. Day on market increased in the West Virginia Panhandle.
- Overall, the average days on market increased to 59 days from 55 last year.
- While we certainly expect next week’s numbers to be down given the impact of the storm, but the year is off to a good start.
The Real Estate Details
- Virginia Countryside was up 37.0% and is up 33.0% year-to-date.
- West Virginia Panhandle was up 19.4% and is up 12.6% year-to-date.


